High CPU load on domain controllers caused by imaging clients
/Here’s an interesting issue we’ve encountered at work. This also demonstrates how useful Cacti can be in graphing what’s going on in your server environment. Even if you don’t have alerting, simply graphing what your “normal” usage is can alert you to problems as well as help you put timelines together that allow you to figure out the source.
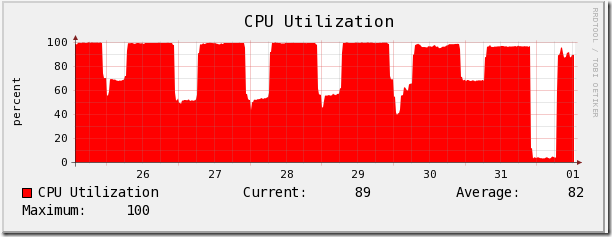
I was glancing over some server utilization charts and saw this one, which shows CPU usage jumped way off the charts over Christmas break:
Why is that? We didn’t suddenly quintuple in size? Digging closer, I realized a definite pattern to the CPU load:
You can see that the load quiets down at night, and goes up in the morning, in pretty much a specific pattern. Digging into the graphs revealed that it was almost down to the minute, which probably means it’s some type of automated source, as no user works from 7:00 a.m. to 10:30 p.m. every day.
The network graph showed a similar pattern, which gave me a good shot of capturing it. I turned on Network Monitor, and ran a capture for 30 seconds, here’s what it saw:
Holy cow! In 30 seconds I saw over 30,000 Frames from some of those clients! The highest “normal” client I see is 136 frames in that time period. Now that I knew where the traffic was coming from, I just had to figure out why. I contact the administrator for those clients, who said that they had been re-imaged in the last few weeks.
Further investigation has shown these clients to have all been imaged with an improperly prepared image, causing them to essentially fight over the same records in Active Directory and DNS continuously. The quiet periods were when the computer labs were shut down for the evening automatically to save energy, and then automatically powered back up in the morning before classes started in them.


